
For startup founders and marketers, the pursuit of success requires not just vision and innovation but also a keen understanding of the metrics that drive sustainable growth. In the dynamic startup ecosystems, monitoring and interpreting key performance indicators (KPIs) can be the compass guiding your vessel through the challenges. In this blog post, we delve into the heartbeat of startup marketing, uncovering the significance of ten essential metrics that can make or break the trajectory of your business.
From the intricacies of Customer Acquisition Cost (CAC) to the nuanced world of Email Marketing Metrics, each metric serves as a critical puzzle piece in the larger picture of startup success. Join us on this exploration as we demystify these metrics, sharing real-world scenarios and actionable insights that will empower you to steer your startup towards unparalleled growth. Let’s embark on this journey of metrics mastery together.
Let’s start with the first key metric: Customer Acquisition Cost (CAC). I’ll cover its definition, importance, examples, benchmarks, challenges, best practices, and a simple formula.
What is Customer Acquisition Cost (CAC)?
Customer Acquisition Cost (CAC) refers to the total expense incurred by a company to acquire a new customer. This includes all marketing and sales costs—advertising expenses, salaries of marketing and sales teams, costs of marketing and sales tools, and any other related expenses—over a specific period.
Why Does CAC Matter?
CAC is crucial for several reasons:
- Profitability Assessment: It helps businesses understand whether the cost of acquiring a new customer is sustainable and profitable in the long run.
- Budget Allocation: CAC informs how much a company should budget for marketing and sales efforts.
- ROI Analysis: It’s a key metric to evaluate the return on investment for different marketing strategies and channels.
- Pricing Strategy: Understanding CAC can guide pricing strategies to ensure profitability.
- Growth Planning: Companies can use CAC to forecast growth and set realistic customer acquisition targets.
Basic and Complex Example of CAC in Practice
- Basic Example: A startup spends $1,000 on a Google Ads campaign and acquires 10 new customers. The CAC is $1,000 / 10 = $100 per customer.
- Complex Example: A software company spends $50,000 on various marketing efforts, including digital ads, content marketing, and trade shows. Additionally, their sales team, whose total cost including salaries and commissions is $100,000, converts 300 leads into customers. The CAC is ($50,000 + $100,000) / 300 = $500 per customer.
Benchmarks
CAC benchmarks vary significantly across industries and business models. For instance, in the SaaS industry, a healthy CAC might range from $90 to $250 for small to mid-sized businesses. However, it’s essential for companies to compare their CAC against competitors or industry averages to understand their performance.
Challenges
- Rising Acquisition Costs: In competitive markets, the cost to acquire customers can escalate quickly.
- Allocating Costs: Properly attributing costs to customer acquisition in businesses with multiple products or channels can be complex.
- Long Sales Cycles: For businesses with long sales cycles, accurately calculating CAC becomes challenging.
Best Practices
- Diversify Acquisition Channels: Don’t rely solely on expensive channels; explore organic and referral methods.
- Improve Conversion Rates: Optimize the sales funnel to convert leads to customers more efficiently.
- Monitor and Adjust Regularly: Regularly review CAC to identify trends and make necessary adjustments.
- Customer Retention: Focus on retaining customers to spread the acquisition cost over a longer relationship period.
Simple Formula
The basic formula for CAC is:
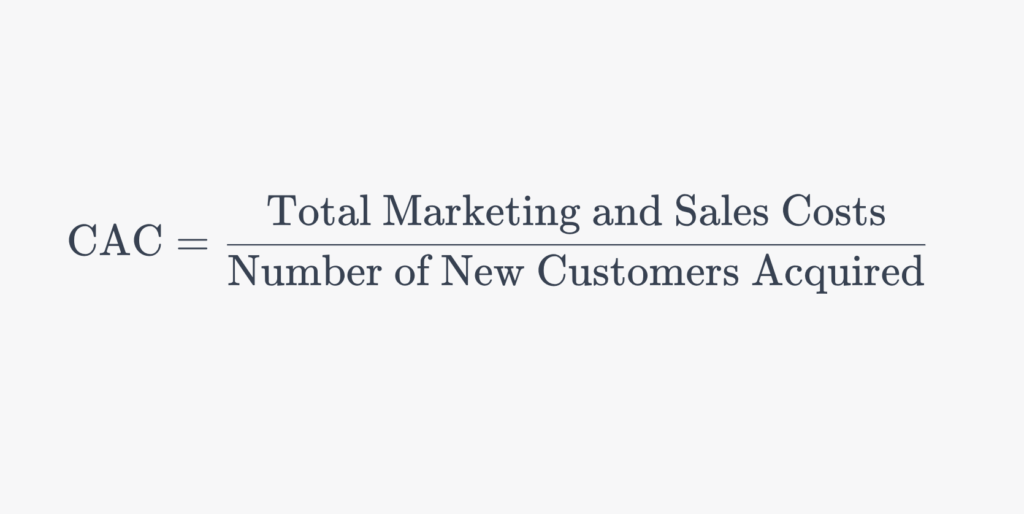
This formula can be adapted to reflect specific time periods, marketing channels, or customer segments.
Now, let’s delve into the second key metric: Conversion Rate. I’ll explore its definition, importance, examples, benchmarks, challenges, best practices, and a simple formula for understanding and calculating it.
What is Conversion Rate?
The conversion rate is the percentage of visitors to a website or users of a service who take a desired action, which can range from making a purchase, signing up for a newsletter, to downloading a whitepaper. It’s a key indicator of the effectiveness of a marketing strategy and the user experience on a website or app.
Why Does Conversion Rate Matter?
- Efficiency Indicator: A high conversion rate means your marketing efforts and website are effectively persuading visitors to take the desired action.
- Cost-Effectiveness: Improving conversion rates can be more cost-effective than increasing traffic.
- Customer Insight: It provides insights into customer behavior and preferences.
- Profitability: Higher conversion rates often lead to increased profitability.
Basic and Complex Example of Conversion Rate in Practice
- Basic Example: If a website receives 1,000 visitors and 50 of them make a purchase, the conversion rate is 50 / 1,000 = 5%.
- Complex Example: An e-commerce site has multiple conversion goals: purchases, newsletter sign-ups, and account registrations. If it receives 10,000 visitors, with 300 purchases, 200 sign-ups, and 100 registrations, the conversion rates are 3% for purchases, 2% for sign-ups, and 1% for registrations.
Benchmarks
Conversion rate benchmarks vary by industry, platform, and type of conversion. For instance, the average e-commerce conversion rate is typically around 1-2%, but this can be higher or lower depending on the sector and the nature of the products or services.
Challenges
- Traffic Quality: Poor quality traffic can negatively impact conversion rates.
- User Experience: A website or app that is difficult to navigate can deter conversions.
- Market Variation: Conversion rates can vary widely across different markets and audience segments.
Best Practices
- Optimize User Experience: Ensure your website or app is user-friendly, fast, and responsive.
- Clear Call-to-Action: Make your call-to-action (CTA) buttons and messages clear and compelling.
- A/B Testing: Regularly test different elements (like page layouts, CTAs, and content) to improve conversions.
- Personalization: Tailor content and offers to different user segments to increase relevance and conversion likelihood.
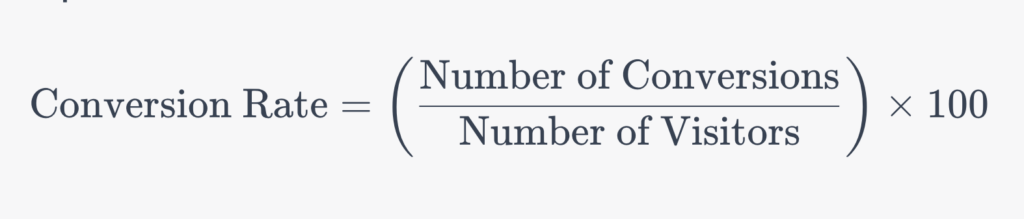
Simple Formula
The basic formula for calculating the conversion rate is:

Moving on to the third key metric, let’s discuss Lead Generation (Number of Leads).
What is Lead Generation (Number of Leads)?
Lead generation refers to the process of attracting and converting prospects into someone who has indicated interest in a company’s products or services. The number of leads is a quantifiable metric that represents the total number of potential customers acquired through various marketing initiatives.
Why Does Lead Generation Matter?
- Sales Pipeline: Leads are the foundation of the sales pipeline; more leads typically mean more opportunities for sales.
- Growth Indicator: The number of leads is a direct indicator of the reach and effectiveness of marketing campaigns.
- Market Interest: This metric helps assess the level of interest in a product or service.
- Strategy Adjustment: Monitoring lead generation assists in tweaking marketing strategies for better performance.
Basic and Complex Example of Lead Generation in Practice
- Basic Example: A small business runs a Facebook ad campaign resulting in 100 people filling out a contact form. These 100 individuals are considered leads.
- Complex Example: A tech company uses multiple channels for lead generation, including webinars, trade shows, content marketing, and PPC campaigns. They track each channel separately and analyze the quality and conversion rates of leads from each source to optimize their strategy.
Benchmarks
Benchmarks for lead generation vary by industry, market, and channel. For example, B2B companies might consider 10-15% conversion from lead to opportunity as a healthy rate, whereas B2C companies might have different expectations based on their market dynamics.
Challenges
- Lead Quality: Generating a high number of leads doesn’t ensure their quality or conversion potential.
- Cost Management: Balancing the cost of lead generation with the quality and conversion rate is challenging.
- Channel Diversity: Identifying and optimizing the most effective channels for lead generation requires constant testing and adaptation.
Best Practices
- Target Audience Understanding: Know your target audience and tailor your lead generation strategies to them.
- Content Quality: Provide valuable and relevant content to attract high-quality leads.
- Multichannel Approach: Utilize a mix of channels (social media, email, SEO, etc.) to broaden reach.
- Lead Scoring: Implement lead scoring to prioritize leads based on their potential value and likelihood of conversion.
Next, we’ll explore the fourth key metric: Customer Lifetime Value (CLV or LTV).
What is Customer Lifetime Value (CLV or LTV)?
Customer Lifetime Value (CLV or LTV) is a prediction of the total value a business will derive from their entire relationship with a customer. It reflects the net profit attributed to the entire future relationship with a customer.
Why Does CLV Matter?
- Long-Term Profitability: Understanding CLV helps businesses focus on long-term profitability rather than short-term gains.
- Resource Allocation: It guides where to allocate resources for maximum return, such as customer retention and acquisition.
- Customer Segmentation: CLV aids in identifying high-value customer segments for targeted marketing.
- Pricing Strategy: It influences decisions regarding pricing, sales, and marketing strategies.
Basic and Complex Example of CLV in Practice
- Basic Example: A subscription service charges $10 per month. If the average customer stays for 3 years, the CLV is 3 years * 12 months/year * $10/month = $360.
- Complex Example: A retail company analyzes customer purchase history, frequency, and retention rate. They use these data points to calculate CLV by segment, considering factors like average purchase value, purchase frequency, and average customer lifespan.
Benchmarks
CLV benchmarks vary significantly across industries and business models. For instance, in e-commerce, a high CLV would be several times greater than the initial purchase value, whereas, in high-value B2B settings, CLV can amount to several thousand dollars.
Challenges
- Data Collection and Analysis: Accurately calculating CLV requires extensive data and sophisticated analysis.
- Changing Customer Behavior: Fluctuations in customer purchase patterns and retention can impact CLV.
- Long-Term Focus: Businesses often struggle to balance short-term achievements with long-term customer value.
Best Practices
- Enhance Customer Experience: Focus on customer satisfaction and experience to increase retention.
- Personalization: Use customer data to personalize marketing and sales efforts, enhancing the perceived value.
- Feedback Loops: Implement mechanisms to continuously gather and act on customer feedback.
- Segmentation: Segment customers based on their CLV and tailor strategies accordingly.
Simple Formula

This formula can be adapted to include margins and retention rates for a more accurate calculation.
Now, let’s discuss the fifth key metric: Return on Investment (ROI).
What is Return on Investment (ROI)?
Return on Investment (ROI) is a performance measure used to evaluate the efficiency or profitability of an investment. In marketing, it’s used to calculate the return generated on marketing spend. ROI helps in understanding how effectively a marketing campaign or strategy contributes to the bottom line of the business.
Why Does ROI Matter?
- Financial Accountability: It provides a clear picture of the financial return from marketing investments.
- Budgeting and Planning: ROI informs future budget allocation and strategy planning.
- Performance Measurement: It helps in assessing the effectiveness of different marketing channels and campaigns.
- Strategic Decision Making: A key metric for making informed marketing decisions.
Basic and Complex Example of ROI in Practice
- Basic Example: A company spends $1,000 on an ad campaign and generates $3,000 in sales directly from it. The ROI is (3000 – 1000) / 1000 = 200%.
- Complex Example: A company invests in a comprehensive digital marketing strategy, including SEO, content marketing, and social media, costing $50,000. The strategy leads to an increase in sales of $150,000 over a year. The ROI calculation must factor in the cost, the time value of money, and the attribution of sales to the marketing efforts.
Benchmarks
ROI benchmarks can vary significantly across industries and channels. A positive ROI is generally desired, but what constitutes a “good” ROI can depend on the market, business model, and the nature of the marketing activities.
Challenges
- Attribution: Accurately attributing sales to specific marketing activities can be complex, especially in multi-channel strategies.
- Time Frame: Determining the appropriate time frame for measuring ROI can be challenging, as some marketing efforts yield long-term results.
- Data Quality: The accuracy of ROI calculations depends heavily on the quality of the underlying data.
Best Practices
- Clear Goals and Tracking: Set clear goals for marketing activities and ensure robust tracking mechanisms.
- Diverse Channels: Use a mix of marketing channels and continually assess their ROI.
- Continuous Optimization: Regularly review and adjust marketing strategies based on ROI analysis.
- Integrated Approach: Consider both quantitative and qualitative outcomes in your ROI calculations.
Simple Formula
The basic formula for calculating marketing ROI is:

This formula provides a percentage that represents the profitability of marketing investments.
Let’s delve into the sixth key metric: Churn Rate.
What is Churn Rate?
Churn rate, also known as the rate of attrition, is the percentage of customers or subscribers who stop using a company’s products or services within a given time frame. It is a critical metric for businesses that operate on a subscription-based model, as it directly impacts the company’s revenue and growth prospects.
Why Does Churn Rate Matter?
- Customer Retention Insight: High churn rates indicate problems with customer satisfaction, product fit, or service quality.
- Revenue Impact: Churn rate directly affects recurring revenue, especially for subscription-based businesses.
- Business Sustainability: Understanding and managing churn is vital for the long-term sustainability of a business.
- Service Improvement: Analyzing churn can provide insights into areas for improvement in products or services.
Basic and Complex Example of Churn Rate in Practice
- Basic Example: If a subscription service has 1,000 customers at the start of the month and loses 50 by the end, the monthly churn rate is 50 / 1,000 = 5%.
- Complex Example: A SaaS company tracks churn rate not only overall but also across different customer segments, pricing tiers, and usage patterns to identify specific areas where customer retention efforts should be focused.
Benchmarks
Churn rate benchmarks vary by industry and business model. For SaaS and other subscription-based businesses, an acceptable annual churn rate might be in the range of 5-7%. However, lower rates are always better, and many successful companies strive for rates lower than 5%.
Challenges
- Customer Engagement: Engaging customers continuously and effectively to reduce the likelihood of churn.
- Predictive Analysis: Identifying at-risk customers before they churn.
- Market Dynamics: Adapt to changing market trends and customer expectations that can influence churn.
Best Practices
- Customer Feedback: Regularly collect and act on customer feedback to improve their experience.
- Quality Service and Support: Provide high-quality customer service and support to address issues promptly.
- Personalization: Tailor customer experiences based on their preferences and behavior.
- Loyalty Programs: Implement loyalty or reward programs to encourage customer retention.
- Data Analysis: Use data analytics to identify patterns and predictors of churn.
Simple Formula
The basic formula for calculating churn rate is:
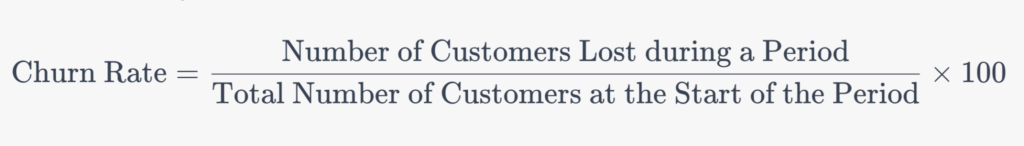
This percentage reflects the proportion of customers who have stopped using the company’s product or service during a specific period.
What is Social Media Engagement?
Social Media Engagement measures how people are interacting with a company’s social media accounts and content. It includes likes, comments, shares, retweets, mentions, and other forms of interaction that occur on platforms like Facebook, Instagram, Twitter, LinkedIn, and others.

Why Does Social Media Engagement Matter?
- Brand Awareness: Higher engagement increases visibility and brand awareness.
- Customer Relationship: Engaging with customers on social media can strengthen relationships and loyalty.
- Market Insight: Engagement can provide insights into what content resonates with your audience.
- Sales Potential: High engagement can lead to increased traffic to your website and potentially higher sales.
Basic and Complex Example of Social Media Engagement in Practice
- Basic Example: A company posts a product photo on Instagram that receives 200 likes, 50 comments, and 30 shares. These numbers collectively represent the engagement for that post.
- Complex Example: A brand runs a social media campaign across multiple platforms with different content types (videos, blogs, interactive posts). They track engagement metrics on each platform and analyze the data to understand which content type and platform yield the highest engagement.
Benchmarks
Engagement rates can vary widely depending on the industry, platform, and audience size. A good engagement rate on Instagram might be around 1-3%, whereas on Facebook, it might be lower due to different audience behaviors and platform algorithms.
Challenges
- Content Creation: Continuously creating engaging, relevant, and high-quality content can be resource-intensive.
- Platform Diversity: Different platforms require different strategies and types of content.
- Measuring Impact: Quantifying the direct impact of social media engagement on sales or brand awareness can be challenging.
Best Practices
- Consistent Posting: Maintain a regular posting schedule to keep your audience engaged.
- Audience Interaction: Actively interact with your audience by responding to comments and messages.
- Content Variety: Use a mix of content types (images, videos, polls, etc.) to keep your audience interested.
- Analytics Tools: Utilize social media analytics tools to track engagement and adjust strategies accordingly.
Simple Formula
There’s no one-size-fits-all formula for social media engagement, but a basic way to calculate an engagement rate for a post is:

This formula gives a percentage that represents the engagement level of your audience with a specific post.
What are Website Traffic Sources?
Website Traffic Sources refer to the various channels through which visitors arrive at a website. These can include direct visits, search engines (organic traffic), social media, referrals from other websites, and paid advertisements.
Why Do Website Traffic Sources Matter?
- Audience Understanding: Knowing where your traffic comes from helps in understanding your audience and their behavior.
- Marketing Strategy: It assists in tailoring marketing strategies to focus on the most effective channels.
- ROI Analysis: Identifying which sources bring the most valuable traffic can aid in measuring ROI for different marketing efforts.
- SEO Optimization: Understanding organic traffic sources can inform SEO strategies.
Basic and Complex Example of Website Traffic Sources in Practice
- Basic Example: A blog analyzes its traffic and finds that 50% comes from social media, 30% from organic search, and 20% from direct visits. This information helps in understanding which channels are most effective.
- Complex Example: An e-commerce site uses advanced analytics to track not only the source of traffic but also the behavior and conversion rates of visitors from each source. They then adjust their marketing spend and strategy based on which sources bring the most valuable traffic.
Benchmarks
The “ideal” mix of website traffic sources varies greatly depending on the type of business, industry, and target audience. Generally, a healthy website will have a diversified traffic portfolio, including direct, organic search, paid search, referrals, and social.
Challenges
- Channel Optimization: Effectively balancing and optimizing different traffic sources.
- Data Interpretation: Correctly interpreting data from various sources can be complex.
- Adaptation to Changes: Search engine algorithms and social media platforms are continually evolving, requiring constant adaptation.
Best Practices
- SEO Best Practices: Employ strong SEO tactics to boost organic search traffic.
- Content Marketing: Use engaging, valuable content to attract and retain visitors.
- Social Media Presence: Maintain an active and strategic presence on relevant social media platforms.
- Data Analysis: Regularly analyze traffic data to understand trends and make informed decisions.
This calculation helps in understanding the contribution of each traffic source to the overall website traffic.
What is Click-Through Rate (CTR)?
Click-Through Rate (CTR) is a metric that measures the percentage of clicks advertisers receive on their ads relative to the number of times the ad is shown (impressions). It’s a key indicator of the effectiveness of online advertising campaigns and email marketing efforts.
Why Does CTR Matter?
- Ad Effectiveness: CTR helps assess how well an ad captures interest and encourages viewers to take the desired action.
- Content Relevance: It indicates the relevance and appeal of ad content to the target audience.
- Campaign Optimization: CTR is used to optimize advertising campaigns for better performance.
- Budget Allocation: Understanding CTR aids in allocating budget more effectively across various campaigns.
Basic and Complex Example of CTR in Practice
- Basic Example: An online ad receives 1,000 impressions and 50 clicks, resulting in a CTR of 50 / 1,000 = 5%.
- Complex Example: A digital marketing campaign uses multiple ad formats and platforms. The CTR for each ad is tracked and analyzed to determine which combinations of ad format and platform yield the highest CTR, indicating where to focus future efforts.
Benchmarks
CTR benchmarks vary widely depending on the industry, the platform (Google Ads, Facebook, etc.), and the type of campaign. For example, an average CTR for Google Ads across all industries might be around 2%, but this can be higher or lower for specific sectors.
Challenges
- Audience Targeting: Effectively targeting the right audience to improve CTR can be challenging.
- Creative Content: Designing ad content that resonates with the audience and prompts clicks.
- Platform Dynamics: Each advertising platform has unique characteristics that influence CTR.
Best Practices
- Strong Call-to-Action: Use clear and compelling CTAs in your ads.
- A/B Testing: Regularly test different elements (copy, images, CTAs) to optimize CTR.
- Targeting and Segmentation: Precisely target ads to relevant audience segments.
- Continuous Monitoring: Keep track of CTR trends and make adjustments as necessary.
Simple Formula
The formula for calculating CTR is:

This formula gives you the percentage of how often people who see your ad end up clicking on it.
What are Email Marketing Metrics?
Email Marketing Metrics are various measures used to assess the effectiveness and impact of email marketing campaigns. Key metrics in this category include open rates, click-through rates (CTR), conversion rates, bounce rates, and unsubscribe rate
Why Do Email Marketing Metrics Matter?
- Campaign Effectiveness: These metrics provide insights into how well email marketing campaigns perform.
- Audience Engagement: They help understand the level of engagement and interest of the audience in the emails sent.
- Content Optimization: Metrics guide the improvement and optimization of email content and design.
- Strategic Decisions: They assist in making informed decisions regarding email marketing strategies and segmentation.
Basic and Complex Example of Email Marketing Metrics in Practice
- Basic Example: An email campaign sent to 1,000 subscribers has a 20% open rate and a 5% click-through rate, indicating that 200 recipients opened the email and 50 clicked on links within it.
- Complex Example: A company segments its email list and sends targeted campaigns. They track metrics like open rates, CTR, and conversion rates for each segment and use this data to refine their targeting and content strategies, achieving higher engagement and conversions.
Benchmarks
Email marketing metrics can vary significantly based on the industry, type of email (newsletter, promotional, transactional), and the target audience. For instance, average open rates might range from 15-25%, while average CTRs might be in the range of 2.5-5%.
Challenges
- Inbox Visibility: Ensuring emails reach the inbox and not the spam folder.
- Content Relevance: Creating content that is relevant and engaging to the recipients.
- List Maintenance: Keeping the email list clean and updated to avoid high bounce rates and spam complaints.
Best Practices
- Personalization: Tailor email content to the interests and behaviors of the audience.
- Segmentation: Segment your email list to send more targeted and relevant messages.
- Testing and Optimization: Continuously test different aspects of your emails (subject lines, content, send times) to find what works best.
- Engaging Design: Use a clear and attractive design to improve readability and engagement.
Simple Formulas
Some basic formulas for key email marketing metrics are:

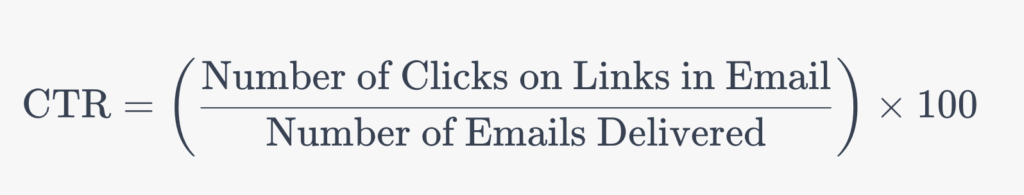

These metrics provide insights into how recipients interact with your emails and what actions they take as a results.
A Comprehensive Deep Dive guide that teaches mastering the T-Shaped Marketer Skill Set for StartUp Marketers.

StartUp Marketer (SUM) is the first marketing ecosystem designed specifically for startup marketers!